






How to Set Up a Business Dashboard: From Ten Numbers to a Live Page
The end-to-end build: metric definitions with exact formulas, per-source extraction patterns, the one-row-per-day storage layer, threshold engineering with owners and playbooks, the rendering ladder, trend rules, the Monday ritual and the dashboard's lifecycle — including an AI summary layer.
This is the hands-on companion to our article on the one-page dashboard every business owner should have. That piece covers the why. This guide covers the how, at the depth a technical founder can execute end to end: exact metric definitions, per-source extraction patterns, the storage schema, threshold engineering, the rendering options with their honest costs, and the operating ritual that keeps the page alive past month two.
You do not need a data team for any of this. You need API access to the tools you already use, a place to run a small scheduled script, and the discipline to keep the page small.
Copy & paste
Start here: plan it with AI
Copy this prompt into any LLM or coding agent (Claude, ChatGPT, Cursor …) to apply this guide to your own project.
Guide: https://blackcard.dev/guides/how-to-set-up-a-business-dashboard
Markdown version (fetch this for the full method): https://blackcard.dev/guides/how-to-set-up-a-business-dashboard.md

I want to set up a one-page business dashboard, following the guide "How to Set Up a Business Dashboard" from blackcard.dev.

The method: pick ONE audience and at most ten numbers; write an exact definition (formula, source, refresh time) for every number BEFORE building, in a definitions document; get READ-ONLY API access to each source tool; run a nightly sync job that stores one dated row per metric per day in a tiny snapshot table; engineer thresholds (static or relative, seasonality-aware) where every red has an owner and a playbook line; render one boring page (tiles with comparisons, one trend vs last year, an exceptions list); run a 10-minute Monday ritual; retire any tile that drives no action for three Mondays.

Interview me one question at a time:
1. Who is the dashboard for, and what decisions do they make weekly?
2. What tools hold our money, sales, operations and customer numbers?
3. Which numbers do people currently ask each other for by email or chat?
4. For each candidate number: what is its exact formula, and could two people compute it differently? (revenue recognized vs invoiced vs cash-in, pipeline weighted vs raw)
5. For each number: if it turned red, who would do what, concretely?
6. Where can a small scheduled script run (server, cloud function, n8n), and does anything genuinely need intraday freshness?

Then produce: my ten-numbers list with formula + source + comparison per number, the definitions document draft, the threshold rule with owner and playbook line per number, and a build plan in the order of the guide.
Step 1: Choose the audience and the ten numbers
Every dashboard that failed tried to serve everyone at once. Pick one audience for version one — usually the owner or managing director — and write down the ten numbers (or fewer) that audience actually steers by. Do this on paper, before any tooling discussion.
Here is a concrete starting set for a small services company — say, a 12-person agency or consultancy. For each number, note the tool where it already lives, because that becomes your source list in Step 3:
- Revenue month-to-date — from the accounting software (Xero, QuickBooks, sevDesk, lexoffice)
- Cash position — accounting software or the bank API
- Overdue receivables, total and oldest — accounting software
- Pipeline value — the CRM (HubSpot, Pipedrive, Close)
- Deals with no activity for 7+ days — CRM
- New inquiries this week — CRM or the website form tool
- Projects in progress — the project tool (Asana, Linear, Jira, Notion)
- Projects past their promised date — project tool
- Open support issues and oldest ticket age — the helpdesk (Zendesk, Freshdesk, a shared inbox tool)
- Hours logged vs. plan this month — time tracking, if you bill time
Notice what is not on the list: website traffic, social followers, email open rates. Not because they are worthless, but because the owner of a services company rarely changes a decision because of them. The test for every number: if it turned red on Monday, would someone do something before Tuesday? If not, it stays off version one.
Step 2: Definitions that don't lie
This is the step everyone skips and then pays for every Monday. A dashboard argument is almost never about the data — it is about two people silently using two definitions of the same word. "Revenue" alone has at least three meanings:
- Revenue recognized — work delivered this month, whatever the invoice says. The economically honest number, and the hardest to pull.
- Revenue invoiced — what you billed this month. Easy to pull, flatters you in months where you bill ahead.
- Cash-in — what actually hit the bank. The survival number; lags reality by your payment terms.
None is wrong. Mixing them silently is wrong. The same trap hides in "pipeline" (raw sum of open deals vs weighted by stage probability — raw pipeline is a motivation number, weighted is a forecasting number, and a page should say which it shows), in "open projects" (started? signed? staffed?), and in "response time" (first response or resolution?).
The defense costs one page: a definitions document, versioned next to the sync job, one block per metric. The format that has survived every Monday argument we've seen:
metric: revenue_mtd
formula: SUM(invoice line amounts, net of tax and credit notes)
         WHERE invoice date within current calendar month
basis: invoiced (not recognized, not cash-in)
source: accounting tool — invoices endpoint, status != draft/void
comparison: vs same calendar month last year, same day-of-month
refresh: nightly 06:00
owner: Lena (finance)
known gaps: credit notes posted late can restate the last 3 days

metric: pipeline_value
formula: SUM(deal amount) for open deals in stages 2-5
basis: RAW (unweighted) — motivation number, not a forecast
source: CRM — deals endpoint, pipeline "new business" only
comparison: vs 4-week rolling average
refresh: nightly 06:00
owner: Jonas (sales)
Every future tile starts life as a block in this document. If you cannot write the block — formula, basis, source, comparison, owner — the number is not ready for the page.
Step 3: Get read-only access to each source
Your dashboard reads from the tools where work already happens. Every modern business tool exposes its data through an API, and grants access through an API key or token — a long secret string that acts like a password for programs instead of people.
Where you typically find it:
- Accounting software: look for "Developer", "API" or "Integrations" in the settings. Xero and QuickBooks use OAuth apps (a few more clicks, same idea); sevDesk and lexoffice hand you a token directly.
- CRM: HubSpot calls them "Private apps" (Settings → Integrations), Pipedrive has "Personal API token" under account settings, Close has API keys in the organization settings.
- Project tools: Asana and Linear issue personal access tokens under account/security settings; Jira uses API tokens from your Atlassian account; Notion uses "internal integrations".
- Helpdesk: Zendesk and Freshdesk both expose API tokens in the admin area.
Three rules while you collect these:
- Read-only wherever the tool allows scopes. Your dashboard never writes anything. If a read-only key leaks, someone sees data; if a full-access key leaks, someone can change or delete it.
- One key per source, stored as environment variables on the machine or service that runs the sync job — never in the code and never in a shared document. Prefer tokens owned by a machine account over anyone's personal account, so the dashboard survives staff changes.
- Note each API's rate limits as you go. A nightly job making tens of requests will never hit them — but a backfill loop fetching a year of history item by item will, and the symptom (silent throttling, partial data) looks exactly like a bug in your code.
If one of your tools genuinely has no API, do not let that block the project. Start the dashboard without that number, or accept one manual entry per week for that single value — clearly labeled with its date.
Step 4: Extraction patterns per source
All sources end in the same snapshot row, but they do not give up their numbers the same way. The patterns:
Pull nightly (the default). A scheduled script calls each API once per night and computes the metrics. This covers 90% of owner dashboards: every number from Step 1 is a "state of the world" number — overdue total, open deals, projects in progress — and state polled daily is exactly right. Intraday freshness roughly triples build effort (webhooks, state reconciliation, more failure modes) and changes almost no decisions; earn it only for a number someone acts on within hours, like support queue depth in a support-heavy business.
The aggregate-vs-list choice. Some APIs give you sums directly (a reports endpoint), others only paginated lists you sum yourself. Prefer the list-and-sum route even when a report endpoint exists: lists let you also extract the exceptions ("which three invoices are overdue?") — and the exceptions list on the page is where the action lives. Watch pagination: an API that returns 100 items per page returns 100 items per page, and the quiet truncation of page two is the classic source of a dashboard that undercounts.
Webhooks (the exception). Tools can push events ("deal closed") to you in real time. Resist them for v1 — a missed webhook silently corrupts your count, so webhook-driven numbers need nightly reconciliation against a full pull anyway. If you need one intraday number, run the same pull hourly for that source instead; it is dumber and therefore more reliable.
Timezones and month boundaries. Decide one timezone for the whole dashboard (your company's), convert every API timestamp into it, and compute "month-to-date" against it. The alternative is a dashboard that disagrees with your accountant for the first and last day of every month.
Step 5: The storage layer — one dated row per day
The pattern that makes dashboards trustworthy is boring on purpose: the nightly job stores one row per metric per day, and never overwrites history.
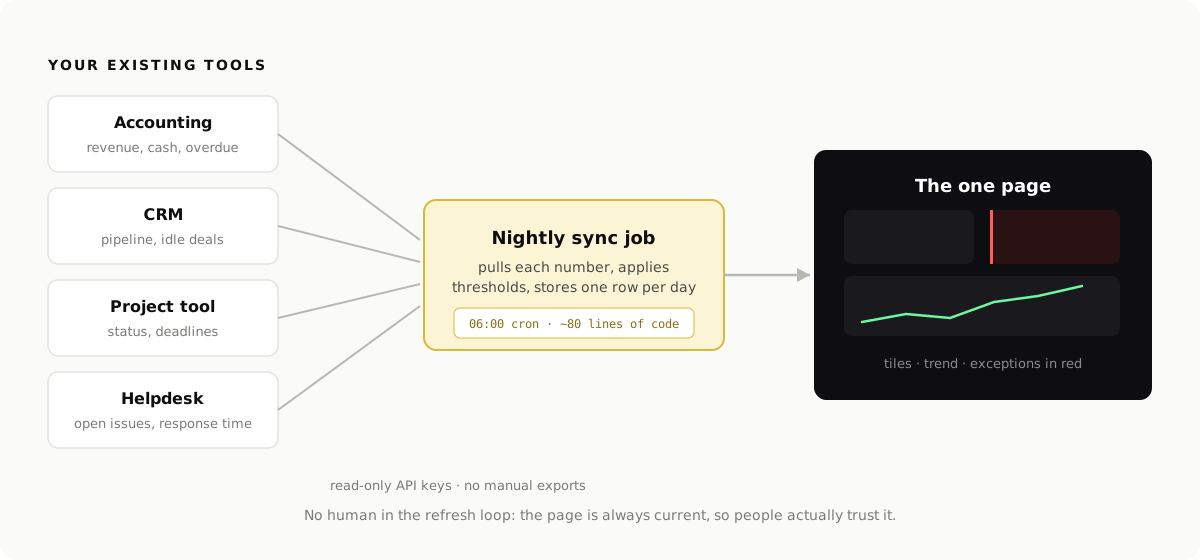
The whole schema:
CREATE TABLE metric_snapshots (
  date        DATE NOT NULL,          -- the snapshot day
  metric      TEXT NOT NULL,          -- 'revenue_mtd', 'pipeline_value', ...
  value       NUMERIC NOT NULL,
  status      TEXT NOT NULL,          -- 'ok' | 'amber' | 'red' | 'stale'
  detail      JSONB,                  -- the exceptions: list of overdue invoices, idle deals, ...
  fetched_at  TIMESTAMPTZ NOT NULL,
  PRIMARY KEY (date, metric)
);
That is the entire "data warehouse". Ten metrics × 365 days is 3,650 rows a year — SQLite or a small Postgres handles a decade of this without noticing. Why this beats reaching for a real warehouse at this scale:
- History is free. Trends, "vs last month", "vs same month last year" — all just queries over rows you were storing anyway. The dashboards that can't show trends are the ones that only ever stored "current".
- Re-runs are safe. The primary key on (date, metric) plus an upsert means running the job twice tonight changes nothing — the same idempotency principle as any good automation.
- The
detailcolumn carries the exceptions — the named overdue invoices, the idle deals — so the page can show actionable sentences, not just totals. status: staleis a first-class value. When a source fails, store the other metrics, mark this one stale, and render it with its last-known date. A dashboard that admits "accounting data from Nov 9" stays trusted; one that quietly shows old numbers as current does not.
The sync job itself stays under a hundred lines. The shape, pulling two example numbers (the URLs and field names are placeholders — substitute the endpoints from your own tools' API docs):
// sync.ts — runs every night at 06:00 via cron or a scheduled function

async function fetchOverdueInvoices(): Promise<{ total: number; oldestDays: number; list: any[] }> {
  // ← replace URL + auth with your accounting tool's "list invoices" endpoint
  const res = await fetch("https://api.your-accounting-tool.com/v1/invoices?status=overdue", {
    headers: { Authorization: `Bearer ${process.env.ACCOUNTING_API_KEY}` },
  });
  const invoices = await res.json();
  return {
    total: invoices.reduce((s: number, i: any) => s + i.amountDue, 0),
    oldestDays: Math.max(...invoices.map((i: any) => daysSince(i.dueDate)), 0),
    list: invoices.map((i: any) => ({ ref: i.number, client: i.client, amount: i.amountDue, days: daysSince(i.dueDate) })),
  };
}

async function run() {
  const inv = await fetchOverdueInvoices();
  await upsertSnapshot({
    date: today(),
    metric: "overdue_receivables",
    value: inv.total,
    status: applyThreshold("overdue_receivables", inv),
    detail: inv.list,
  });
  // ...one block per metric; a failed fetch writes status 'stale', keeps last value
}

run();
Where it runs: anywhere that executes a script on a schedule — a cheap VPS with cron, a scheduled serverless function, a GitHub Actions timer, or an n8n schedule node calling your script. Pick what your team already knows.
Step 6: Threshold engineering
Thresholds turn a report into an early-warning system — and badly engineered thresholds train the team to ignore the page, which is worse than no thresholds. Four principles:
Static where the floor is absolute, relative where "normal" drifts. Cash below two months of costs is red at any company size — static. New inquiries are seasonal and grow with you — a static "red below 5" is wrong by June; compare against a rolling average instead ("red: below 60% of the 8-week average"). Rule of thumb: money floors are static; activity volumes are relative.
Respect seasonality explicitly. If August is always quiet, an August red is noise. Either compare year-over-year for seasonal metrics, or encode known quiet periods — otherwise the team learns "red in summer means nothing", and that lesson does not stay contained to summer.
Every red has an owner and a playbook line. Not a department — a name. Not "look into it" — the first action:
overdue_receivables:
  red:   total > 5000 EUR OR oldest > 14 days
  amber: total > 2000 EUR
  owner: Lena (finance)
  action: payment reminder same day; call the client at 21 days

idle_deals:
  red:   any deal > 10000 EUR with no activity for 14 days
  amber: any deal with no activity for 7 days
  owner: Jonas (sales)
  action: follow-up logged in CRM within 24h

new_inquiries:
  red:   this week < 60% of 8-week rolling average   # relative, not static
  owner: Mara (marketing)
  action: check tracking first (is the form broken?), then channels

cash_position:
  red:   < 2 months of average monthly costs          # static floor
  amber: < 3 months
  owner: owner
  action: review receivables + upcoming spend this week
Defend against alert fatigue with a budget. If the page shows more than two or three reds for two straight weeks, the thresholds are wrong or the business has a real crisis — both deserve a meeting, not a shrug. A red that fires weekly and never changes behavior gets retuned or the metric gets removed. Red must stay expensive.
Start loose and tighten after a few weeks of real values. Calibration is the Monday ritual's job, not a design-time guess.
Step 7: The page itself
Only now does the visible part begin — deliberately last, because the page is the easiest part once the data flows. Version one needs exactly three elements:
- Tiles for the ten numbers, each with its comparison, colored by its threshold state (and showing "stale since …" when a source failed).
- One trend chart — usually revenue by month. Plot this year against last year, not against last week. Last-week comparisons amplify noise; last-year comparisons show the business. And hold the line until a trend has at least six data points — four points of "trend" is a horoscope.
- An exceptions list — every red and amber item as a sentence a human can act on ("Invoice #2041 — 24 days overdue — DropFriends GmbH — €9,400"), sorted red first. This list, fed from the
detailcolumn, is where Monday's actions come from.
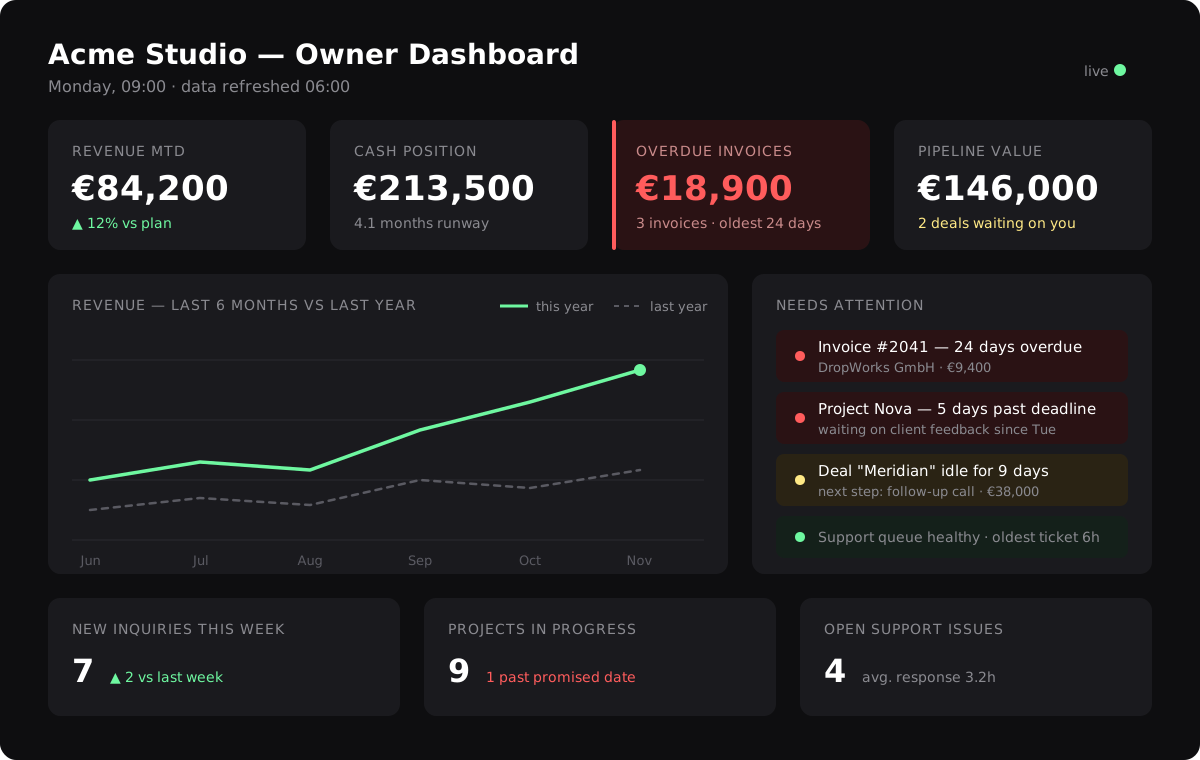
The rendering ladder, with honest costs:
- A static HTML page, re-rendered by the sync job each night. Cost: half a day to build, near-zero to run; behind basic auth or the intranet. Limitations: one audience, no interactivity. This is a genuinely good version one, and many companies rightly never leave this rung.
- A small Next.js (or similar) app reading the snapshot table. Cost: a few days, plus hosting and a login to maintain. Buys you: proper auth, multiple audience pages (owner, sales, ops) over the same data, drill-down from a tile to its exceptions. Climb here when a second audience actually asks, not before.
- An off-the-shelf BI tool (Metabase, Grafana) on the snapshot table. Cost: an afternoon to stand up, then a permanent tax: these tools make adding charts frictionless, and frictionless adding is the disease. Choose this rung only with a named gatekeeper for the one page — and accept that threshold logic (owners, playbooks, stale handling) lives better in your sync job than in a BI tool's alert system.
What to avoid on every rung: animations, gauges, more than two colors beyond red/amber, and anything needing a legend. The owner should absorb the page in under thirty seconds — that is the entire point.
Step 8: The Monday ritual — ten minutes, fixed agenda
A dashboard nobody discusses decays into wallpaper. The habit that keeps it alive:
Monday, 10 minutes, same time every week, page on screen.
- Minutes 0–1 — stale check. Anything stale or wrong? If yes, fixing the pipe is this week's first ticket; nothing else on a stale page is worth discussing.
- Minutes 1–6 — reds, by owner. For each red, its owner speaks (nobody else goes first): one sentence of cause, one sentence of action, from the playbook line. No owner present = the red is noted and chased, not skipped.
- Minutes 6–9 — movement. What changed vs last week, ambers drifting the wrong way, anything the trend line newly shows.
- Minute 9–10 — page health. Any tile that again drove no conversation gets a strike. Any question asked for the third straight week earns a ticket to become a tile.
Everything that needs more than a sentence becomes a ticket, not a discussion — the ritual protects its ten minutes or it dies. Remote teams: same agenda as a posted screenshot plus a thread, owners reply on their reds before noon.
Step 9: Lifecycle — how the page evolves without bloating
- The retirement rule: three Mondays with no action → the tile dies. Count the strikes from the ritual. An honest ten numbers beat a stale fourteen, and the ten-tile budget means adding one requires removing one — which forces the useful conversation about what matters more.
- Promotion needs a definition first. A recurring question becomes a tile only after it has a block in the definitions document (formula, source, owner, threshold). No block, no tile.
- Recalibrate quarterly. Thresholds drift as the business grows; a 30-minute quarterly pass over the YAML keeps red meaning red.
- The AI summary layer — the natural upgrade once the data flows. A small weekly agent reads the last 14 days of snapshot rows and writes the narrative on top of the page: three sentences on what moved, which reds persist and who owns them, and one trend worth a look — posted to the team chat an hour before the Monday ritual. The numbers stay computed by code (the agent summarizes rows, it never invents or recalculates values — same grounding rule as any reporting agent); the prose just removes the last excuse not to read the page. Our one-page dashboard article shows what the result feels like from the owner's seat.
Common failure modes
Four patterns kill most dashboards. Check for them explicitly:
- Manual refresh creeps back in. Someone adds "just one column" needing a weekly export, then goes on holiday, and the page is three weeks old and trust is gone. The rule: nothing goes on the page unless the sync job can fetch it; one clearly-labeled manual number is the absolute maximum exception.
- Two definitions of one word. The Monday argument about "whose revenue number is right" means Step 2 was skipped. The definitions document is the arbiter; update it, not the meeting.
- No thresholds, or cheap reds. A page of neutral numbers is a report; a page where red fires weekly and changes nothing is an alarm everyone has unplugged. Both are solved by owner + playbook + the red budget.
- Dashboard by committee. Designing for three audiences at once produces a page serving none. Ship the owner's page; let sales and ops pages be fast followers on the same snapshot table.
Build it yourself, or build it with us
Everything in this guide is achievable for a developer comfortable with APIs — the first version is typically a few days of focused work, and the pattern (definitions, read-only keys, nightly snapshots into one table, engineered thresholds, one boring page, the Monday ritual) is deliberately simple to maintain.
Copy & paste
Do it: the full prompt
Copy this prompt into any LLM or coding agent (Claude, ChatGPT, Cursor …) to apply this guide to your own project.
Guide: https://blackcard.dev/guides/how-to-set-up-a-business-dashboard
Markdown version (fetch this for the full method): https://blackcard.dev/guides/how-to-set-up-a-business-dashboard.md

Act as my implementation partner and build the dashboard from the guide "How to Set Up a Business Dashboard" (blackcard.dev). Method: exact metric definitions first, read-only API access per source, a nightly sync job writing one dated row per metric per day into a single snapshot table (with status ok/amber/red/stale and a detail field for exceptions), engineered thresholds where every red has an owner and a playbook action, one boring page (tiles + one trend vs last year + exceptions list), and a 10-minute Monday ritual with a three-strikes tile-retirement rule.

My situation:
- Audience: [owner / sales lead / operations]
- The ten numbers with formula and source: [e.g. revenue MTD (invoiced, net) - sevDesk; pipeline (raw, stages 2-5) - HubSpot; overdue invoices - sevDesk; open tickets - helpdesk ...]
- Where the sync job can run: [small VPS with cron / cloud function / n8n schedule]
- Stack preference for the page: [static page re-rendered nightly / small Next.js app]
- Company timezone: [e.g. Europe/Berlin]

Steps:
1. Draft my definitions document: one block per metric with formula, basis (e.g. invoiced vs recognized vs cash-in; raw vs weighted pipeline), source endpoint, comparison, refresh and owner. Ask me to resolve any ambiguous definition before coding.
2. Write the nightly sync job: pull each number via READ-ONLY credentials from environment variables, sum from list endpoints (handling pagination), convert timestamps to my timezone, and UPSERT one row per metric per day including the exceptions in the detail field. On a failed source: keep last value, mark status stale.
3. Implement my threshold rules (static for money floors, relative with rolling averages for activity volumes), each with owner and action line, in a versioned config file.
4. Render the page: tiles with comparisons and stale labels, ONE 12-month trend vs last year (only once 6+ data points exist), and an exceptions list sorted red first.
5. Give me deployment steps, the backfill approach for historical data without hitting rate limits, and the Monday ritual agenda with the three-strikes retirement rule.
Deliver complete, runnable code plus setup instructions, then wait for my feedback after the first week.
If you would rather have it built properly in one go — definitions workshopped with you, sources connected, thresholds engineered, the page designed to read in thirty seconds, and the Monday ritual installed — that is exactly what we build as business dashboards at BlackCard. Book a free call and bring your list of ten numbers; we will take it from there.