



The One-Page Dashboard Every Business Owner Should Have
Most owners steer their business from gut feeling and a spreadsheet someone updates monthly. Here is how to build one page that shows what is happening, what needs attention and where you are heading.

Here is a test you can run today: ask yourself how the business is doing right now — not last quarter, now — and notice where the answer comes from. For most owners it is a mixture of gut feeling, a bank balance, and a spreadsheet that somebody updates when they get around to it.
That is not a knowledge problem. The numbers exist. They are just spread across your accounting tool, your CRM, your shop system and three inboxes — and assembling them takes long enough that nobody does it weekly. The fix is a one-page dashboard: a single screen that answers three questions at a glance.
The three questions a dashboard must answer
Everything on the page should serve one of these:
- What is happening? The current state: revenue this month, open orders, pipeline value, cash position.
- What needs attention? The exceptions: overdue invoices, stuck deals, support tickets older than two days, a delivery running late.
- Where are we heading? The trend: this month against last month and against the same month last year, not as a data dump but as three or four lines that move.
Most dashboards fail because they only answer the first question. A wall of current numbers is a report, not a steering instrument. The value is concentrated in question two — the exceptions — because that is the part your team currently handles by someone noticing, and "someone noticing" is not a system.
An exact example: the owner page of a 12-person agency
Rather than talk about dashboards in the abstract, here is what one actually looks like — the owner page of a 12-person service business, slightly anonymized:
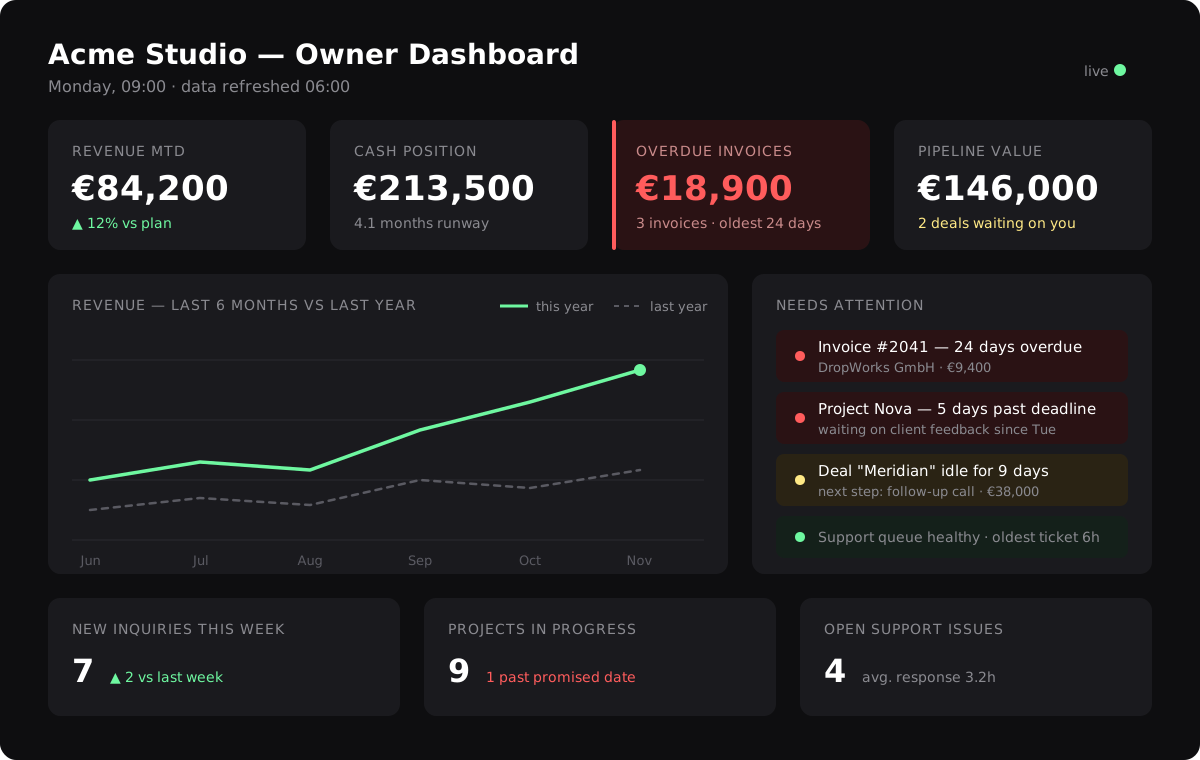
Walk through it region by region:
The four tiles across the top are the questions the owner used to ask people. Each one has a defined threshold that flips it from calm to colored:
- Revenue MTD — compared against the month's plan. Green above plan, neutral within 10% below, red beyond that.
- Cash position — shown with months of runway. The tile turns yellow below 3 months, red below 2. No judgment, just the rule.
- Overdue invoices — this one is red in the example on purpose: the rule is red above €5,000 outstanding or any invoice older than 14 days. Before the dashboard, overdue invoices were discovered "whenever someone ran the report." Now they are discovered at breakfast.
- Pipeline value — with the number of deals waiting on the owner personally, because that was this company's actual bottleneck.
The trend chart shows revenue for the last six months against the same months last year. Two lines, no more. The question it answers is not "what exactly did August do" but "are we structurally ahead of last year or coasting on memory."
The "needs attention" list is the exceptions engine, and it is the part people actually open the page for. Each entry is generated by a rule, not by a person:
- any invoice overdue past 14 days (with customer and amount)
- any project past its promised date (with what it is waiting on)
- any deal idle for more than 7 days (with the next step and value)
- support queue only appears here if the oldest ticket crosses 24 hours — otherwise it shows one calm green line
The bottom row holds the weekly operating numbers: new inquiries, projects in progress, open support issues. Useful, but deliberately demoted — they are context, not alarms.
The exact ten numbers and where each comes from
The whole page runs on ten numbers, each pulled from a system the company already used:
- Revenue month-to-date — accounting tool (invoiced, not hoped)
- Revenue plan for the month — a 12-row config the owner edits once a year
- Cash position — bank feed via the accounting tool
- Overdue receivables (amount, count, oldest) — accounting tool
- Pipeline value — CRM, sum of open deals weighted by stage
- Deals idle > 7 days — CRM, last-activity date per deal
- New inquiries this week — CRM plus the website form
- Projects in progress / past promised date — project tool
- Open support issues and oldest ticket age — helpdesk
- Average first-response time — helpdesk
Notice what is not on the list: website visitors, social followers, total historical customers. Nice numbers. None of them would change what the owner does on a Tuesday.
How the data gets there
No manual exports, no intern with a spreadsheet. Each tool gets a read-only API key — the dashboard can look, never touch. A small nightly sync job (a cron job of roughly eighty lines of code) pulls each number, applies the threshold rules, and stores one row per day, which also gives you history for free. The page itself just renders the latest row and the trend.
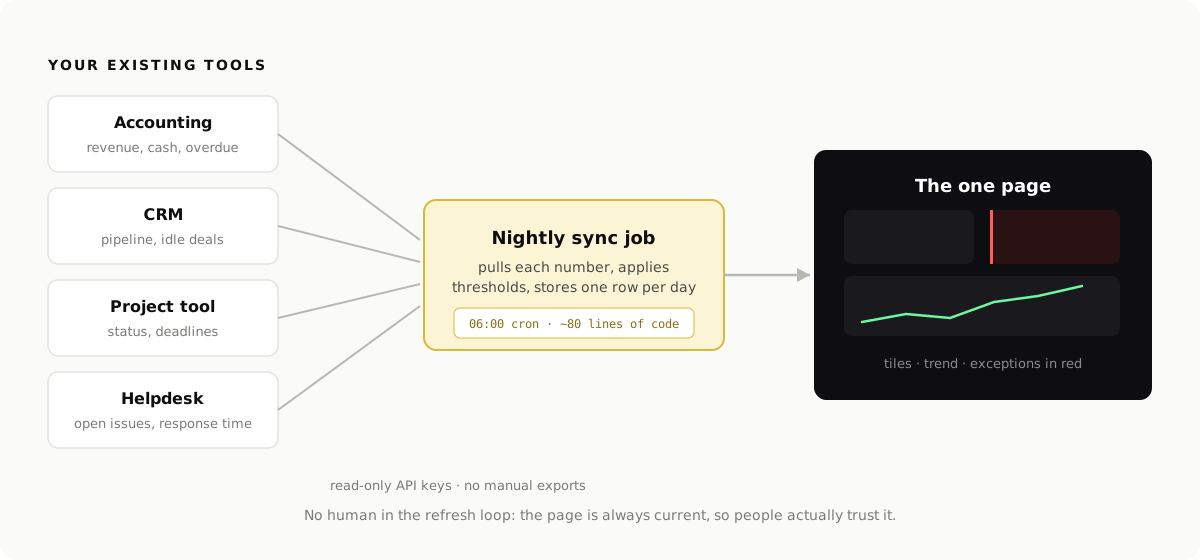
Nightly is almost always enough. Real-time dashboards are a common request and a rare need — the owner checks the page in the morning, not every four minutes. Start with the overnight refresh; upgrade a single number to live later if a real decision depends on it.
What belongs on the page (and what doesn't)
The discipline is in the word one-page. A useful starting set for most businesses:
- Money: revenue month-to-date vs. plan, cash position, overdue receivables
- Sales: new inquiries this week, pipeline value, deals waiting on you
- Operations: orders or projects in progress, anything past its promised date
- Customers: open issues, and one simple satisfaction signal
And the things to leave off: vanity metrics that never change a decision (total historical users, social followers), anything measured so rarely it is always stale, and every number nobody can act on. The test for each tile is brutal and simple — if this number turned red, would someone do something? If not, it is decoration.
Why the spreadsheet version always dies
Almost every company has tried the spreadsheet dashboard. It works for about six weeks. Then the person who updates it gets busy, the numbers go stale, people notice they are stale and stop looking, and the sheet quietly becomes fiction.
The lesson is not that spreadsheets are bad. It is that a dashboard anyone has to update by hand is a handoff waiting to fail. A dashboard earns daily trust only when it pulls its numbers directly from the systems where the work happens — the accounting software, the CRM, the shop, the project tool — with no human in the refresh loop.
How to build one without a six-month project
The good news: this does not require a data warehouse or a BI team. The pragmatic path we take with clients:
- Pick the audience. An owner's page, a sales page and an operations page want different numbers. Start with one audience — usually the owner.
- Choose ten numbers or fewer. Write them down before any tooling discussion. If you cannot name the ten, no tool will save you.
- Connect the sources that exist. Most modern business tools have APIs or exports. The first version can refresh overnight; real-time comes later, if it is needed at all.
- Add the red. Define the thresholds that turn a tile into an exception. This is the step that turns a report into an early-warning system.
- Look at it together, weekly. A dashboard nobody discusses decays. Ten minutes every Monday keeps the numbers honest and surfaces what to improve next.
For the agency above, steps 1–4 took about two weeks of part-time work: a day per data source, a day for the threshold rules, and a day for the page itself. The expensive part was not the code — it was the owner sitting down and committing to the ten numbers.
The quiet payoff
The owners who run on a live one-pager describe the same change: fewer status meetings, because the status is public. Fewer surprises, because problems show up as a red tile at day two instead of an angry email at day twenty. And better delegation — because when everyone sees the same numbers, you no longer have to be the person who notices everything.
Building exactly this — one clear page, connected to the tools you already use, with the exceptions in red — is one of the four things we do at BlackCard. Book a free call and tell us which ten numbers you wish you could see every morning.